Where Does Our World Go?
Nonfiction, Reference & Language, Education & Teaching, Health & Well Being, Self Help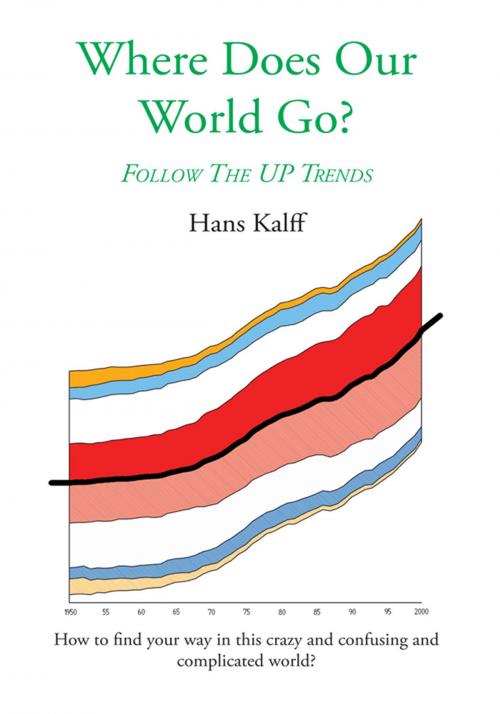
| Author: | Hans Kalff | ISBN: | 9781466958821 |
| Publisher: | Trafford Publishing | Publication: | August 23, 2004 |
| Imprint: | Trafford Publishing | Language: | English |
| Author: | Hans Kalff |
| ISBN: | 9781466958821 |
| Publisher: | Trafford Publishing |
| Publication: | August 23, 2004 |
| Imprint: | Trafford Publishing |
| Language: | English |
We all have but one world. We should make this a better place for present people and for our future generations. How? Nobody knows for sure. However we can learn from past developments that seem to have worked giving people a worthy life, liberty and property.
Look at the nine slices of society that exist everywhere, given sufficient data to measure their effect, searching for the upward trends.
About the Kalff-o-gram: the graph on the front-page shows in the center the upward development of the gross domestic product per head from 1950 = 100 to 2000 = 2827 in the Netherlands. The 100% box on top of this line indicates the change in the mix of 4 groups of workers: agriculture (orange), industry (white), government (blue) and services (red). The 100% box under this line shows their output or contribution to g.d.p.