Clinical Graphs Using SAS
Nonfiction, Computers, Application Software, Business Software, Programming| Author: | Sanjay Matange | ISBN: | 9781629602059 |
| Publisher: | SAS Institute | Publication: | March 21, 2016 |
| Imprint: | SAS Institute | Language: | English |
| Author: | Sanjay Matange |
| ISBN: | 9781629602059 |
| Publisher: | SAS Institute |
| Publication: | March 21, 2016 |
| Imprint: | SAS Institute |
| Language: | English |
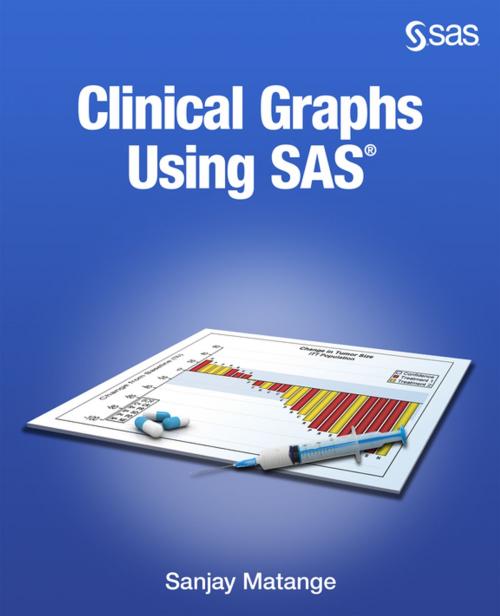
SAS users in the Health and Life Sciences industry need to create complex graphs to analyze biostatistics data and clinical data, and they need to submit drugs for approval to the FDA. Graphs used in the HLS industry are complex in nature and require innovative usage of the graphics features. Clinical Graphs Using SAS® provides the knowledge, the code, and real-world examples that enable you to create common clinical graphs using SAS graphics tools, such as the Statistical Graphics procedures and the Graph Template Language. This book describes detailed processes to create many commonly used graphs in the Health and Life Sciences industry. For SAS® 9.3 and SAS® 9.4 it covers many improvements in the graphics features that are supported by the Statistical Graphics procedures and the Graph Template Language, many of which are a direct result of the needs of the Health and Life Sciences community. With the addition of new features in SAS® 9.4, these graphs become positively easy to create. Topics covered include the usage of SGPLOT procedure, the SGPANEL procedure and the Graph Template Language for the creation of graphs like forest plots, swimmer plots, and survival plots.
SAS users in the Health and Life Sciences industry need to create complex graphs to analyze biostatistics data and clinical data, and they need to submit drugs for approval to the FDA. Graphs used in the HLS industry are complex in nature and require innovative usage of the graphics features. Clinical Graphs Using SAS® provides the knowledge, the code, and real-world examples that enable you to create common clinical graphs using SAS graphics tools, such as the Statistical Graphics procedures and the Graph Template Language. This book describes detailed processes to create many commonly used graphs in the Health and Life Sciences industry. For SAS® 9.3 and SAS® 9.4 it covers many improvements in the graphics features that are supported by the Statistical Graphics procedures and the Graph Template Language, many of which are a direct result of the needs of the Health and Life Sciences community. With the addition of new features in SAS® 9.4, these graphs become positively easy to create. Topics covered include the usage of SGPLOT procedure, the SGPANEL procedure and the Graph Template Language for the creation of graphs like forest plots, swimmer plots, and survival plots.
